Analysis of Confirmed COVID-19 Cases the EU (2020–2022)
By Ursula Tamen, conducted in Mar 2025.
Last updated 20 May 2025

Disclaimer: This analysis was conducted as part of an academic exercise and is not meant to be interpreted as definitive. While based on credible data sources, limitations exist regarding the accuracy of case reporting, and the are no claims made on the correctness of any assumptions and statements made from the data. The author (I) is not an accredited public health professional or analyst, and the interpretations are intended for educational and illustrative purposes only.
Introduction: A Data-Centric Look at a Global Crisis
Between 2020 and 2022, the COVID-19 pandemic profoundly reshaped life across the globe. Governments implemented varying strategies, healthcare systems were overwhelmed, and millions of lives were impacted. To understand the virus’s spread and response patterns across the European Union (excluding the United Kingdom), I analysed COVID-19 confirmed cases data provided by Our World in Data (Ritchie et al., 2020). Using Python in the Spyder IDE, the analysis combined data wrangling, descriptive statistics, correlations, and visualizations to explore how governmental factors influenced infection rates.
The key questions that drove the analysis were:
- How did the number of confirmed cases evolve across different EU countries during the pandemic (2020-2022)?
- What is the relationship between the stringency of government measures and the number of confirmed cases?
Other questions answered include:
- How many cases were reported in the EU in total between 2020 and 2022?
- Which countries recorded the highest and lowest total cases per million in the EU?
- What was the trend of cumulative cases over time between 2020 and 2022 in the EU?
- What was the seasonal trend of new cases in the EU over the months (2020-2022)?
- Top and bottom 5 countries in terms of stringency index (government response) in the EU?
- What was the trend of government response (stringency index) over time in the EU?
- How did different stringency categories compare in case numbers in the EU?
Data Management and Refinement
The original dataset contained 429,435 rows and 67 columns. After defining the scope, I filtered the data to retain:
- Rows for the EU member states (27 excluding UK)
The European Union’s official website lists 27 member states, which are: Austria, Belgium, Bulgaria, Croatia, Cyprus, Czech Republic, Denmark, Estonia, Finland, France, Germany, Greece, Hungary, Ireland, Italy, Latvia, Lithuania, Luxembourg, Malta, Netherlands, Poland, Portugal, Romania, Slovakia, Slovenia, Spain, and Sweden (European Union, n.d.). - Key variables for analysis included:
- iso_code: Country code
- location: Country name
- date: Reported date
- total_cases: Total confirmed cases
- new_cases: New confirmed cases (daily)
- total_cases_per_million: Total cases per million people
- stringency_index: Government stringency measures
- population_density: Country’s population density
- median_age: Median age of the population
Handling Missing Data
After creating my subset data, I began by checking the amount of missing values generally and grouped by country. I used a lambda function to sum all the null values for each country, identified by its iso_code. The missing stringency_index variable, which had almost the same amount of missing data across all countries, led me to suspect that the missing values might have occurred during a period of laxity, possibly due to non-reporting obligations post-confinement.
However, this information alone wasn’t enough to make a definitive decision. To clear my presumption, I plotted a few charts:
➤ Missing Stringency Index Over Time
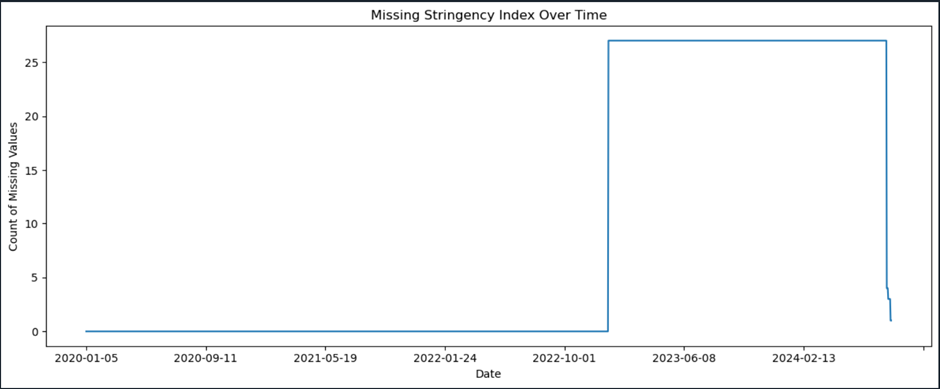
The resulting line chart, though not particularly aesthetic, gave me some useful insights. It showed that missing stringency values began to appear between the end of 2022 and mid-2023.
➤ Chart to Insert: Sample Countries Showing Missing Data (Germany, Ireland, Italy)
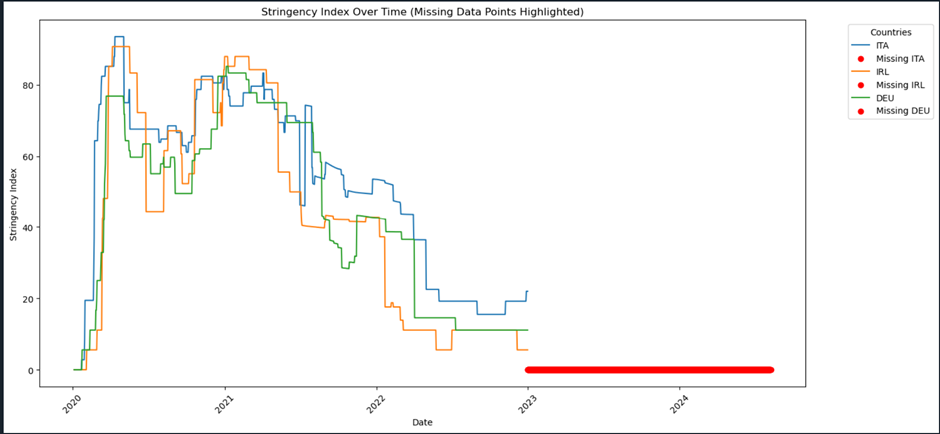
For this chart, I chose to focus on three countries: Italy, Ireland, and Germany. The chart seemed to confirm my assumption that the bulk of missing data occurred in the later years of the pandemic, specifically starting in 2023 (post-confinement). This made a lot of sense because by the end of 2022, with contamination and reproduction rates contained, many countries started lifting restrictions. As policies relaxed, the urgency of reporting might have decreased.
Hence, I restricted the analysis to pre-2023 entries. I decided to limit my analysis to data before 2023 and restricted the rows to only include data from that period to maintain consistency and avoid misleading trends. This refinement left 29,484 rows with complete and usable data.
Summary Statistics and Interpretation
With the data cleaned and a relevant data subset created, I ran detailed descriptive analyses using .describe() to understand the spread and behaviour of key variables.
New Confirmed Cases:
– Mean: 6,065 daily cases across the EU
– Standard Deviation: 53,538
– Max: 2.42 million
On average, there were 6,065 new confirmed cases per day in the EU during the pandemic period (2020-2022). The large deviation indicates highly volatile patterns in daily case counts. This volatility was likely caused by the timing of case surges, varying national outbreaks, delays in data reporting, and possible underreporting in earlier phases. The peak daily count of 2.42 million shows just how intensity and wide spread of the covid virus and its mutants.
New Cases Per Million:
– Mean: 366
– Standard Deviation: 2,025
– Max: 54,641
This variable offered a fairer comparison across countries since it factors the population size. EU countries overall experienced an average of 366 new cases per million people and a peak of 54,641 confirmed per million between 2020 and 2022. The very high standard deviation again highlights sharp disparities between countries and timeframes.
Total Confirmed Cases:
– Max: 37,989,550
– Standard Deviation: 5.11 million
The country with the highest absolute number of confirmed cases was France. However, total case numbers do not consider population size and can misrepresent the true severity of infection spread.
Total Cases Per Million:
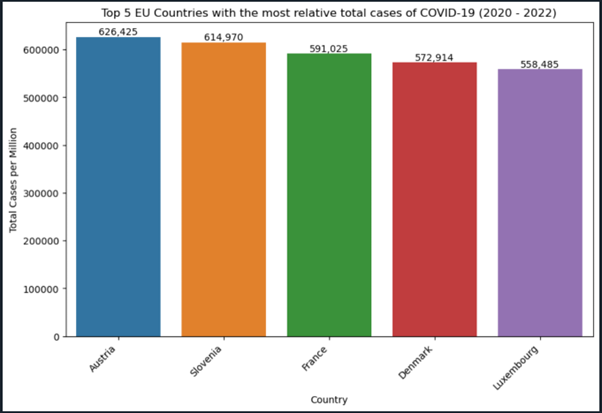
– Max: 626,425
– Standard Deviation: 159,187
The highest relative infection rate occurred in Austria. This high spread rate suggests intense waves and possibly aggressive testing strategies in Austria and similarly ranked countries.
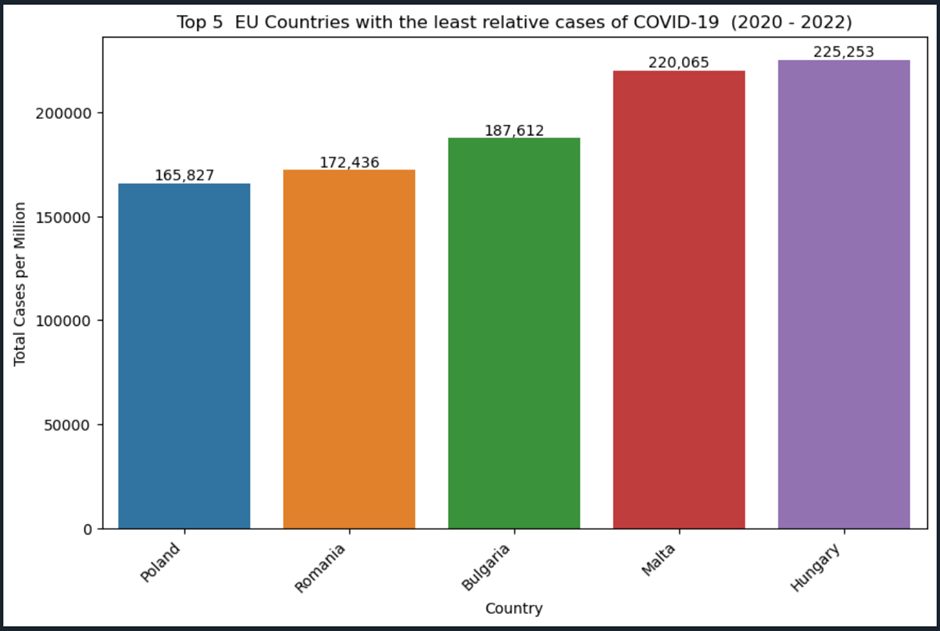
➤ Top and Bottom 5 Countries by Total Cases Per Million
Population Density:
– Mean: 178.67 people/km²
– Range: 19 (Finland) to 1,649 (Malta)
– Standard Deviation: 271.47
Since the standard deviation (271.47) is relatively large compared to the mean (178.67), population density varies significantly EU across countries. The mean is much closer to the lower end (19) than to the upper end (1,649), and the standard deviation is larger than the mean, which suggests a positively skewed distribution (a few very densely populated countries are pulling the average up)
Median Age:
– Mean: 43.08 years
– Range: 37.3 (Cyprus) to 47.9 (Italy)
– Standard Deviation: 2.29
This tells us that most EU countries have similar age structures, at least in terms of the median age. So even though age is a key factor in COVID-19 vulnerability, the low variation across EU countries (they all skew relatively old and similar), make it harder to correlate it with confirmed case rates.
Stringency Index:
– Mean: 40.65
– Max: 96.3
– Standard Deviation: 24.25
This variable captured the level of government-imposed restrictions like lockdowns and travel bans. With such a wide spread, it was clear that EU states pursued different policy paths, both in strictness and timing. Unlike median age (low variation), the stringency index has enough variability to potentially correlate with covid-19 case trends.
➤ Distribution of Stringency Index by Country (Top 5, Bottom 5 by Average Stringency Index)
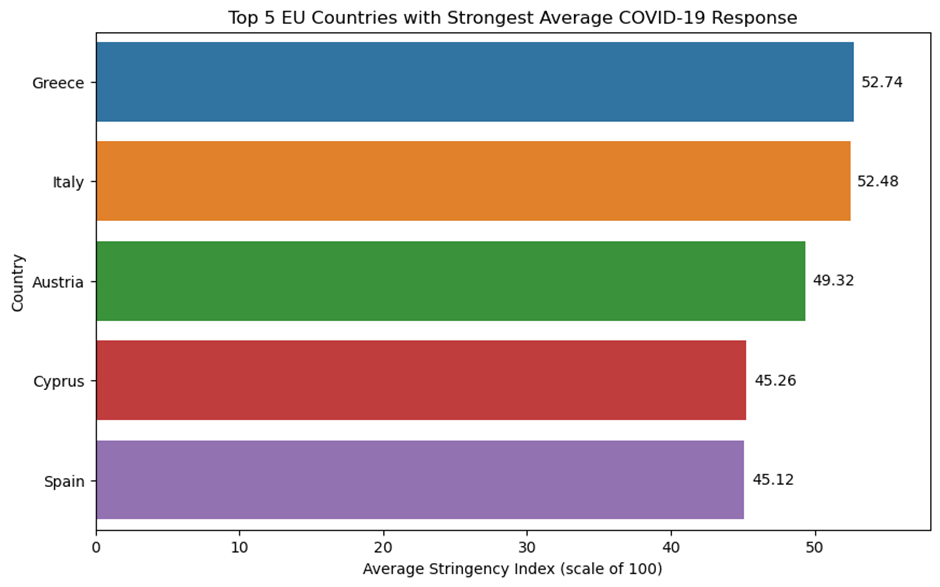
The first chart showcases the Top 5 EU countries with the strongest average COVID-19 response. Ranked in descending order based on their average stringency index, Greece, Italy, Austria, Cyprus, and Spain emerged as the most stringent. Greece led with an average index of 52.74, reflecting a notably strict and sustained application of public health measures throughout the pandemic period.
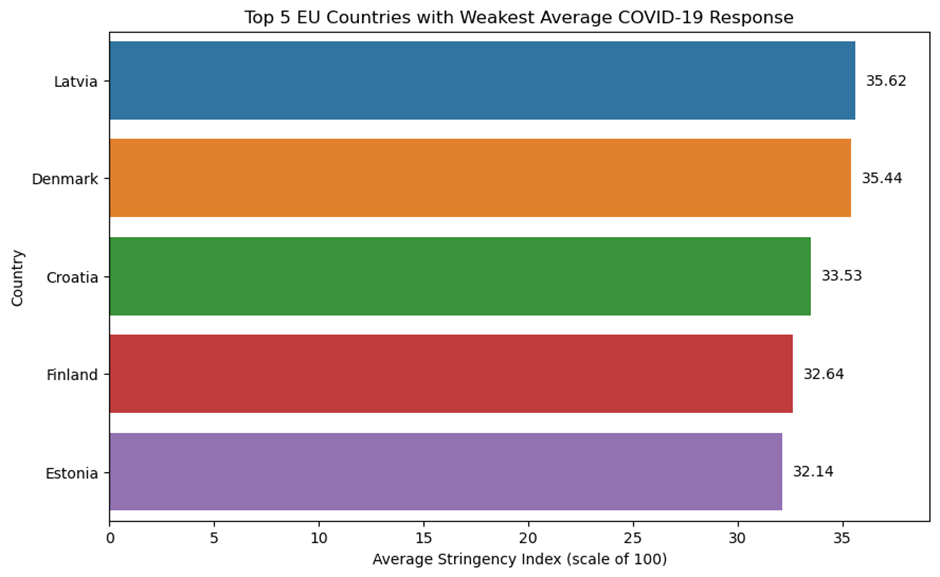
The second chart presents the Top 5 EU countries with the weakest average COVID-19 response. Estonia, Finland, Croatia, Denmark, and Latvia recorded the lowest average stringency levels. Estonia, with an average index of 32.14, had the most relaxed restrictions among them, suggesting a more lenient approach to containment policies.
➤ Chart to Insert: Distribution of Stringency Index by Country (Top 5, Bottom 5 by Max Index)
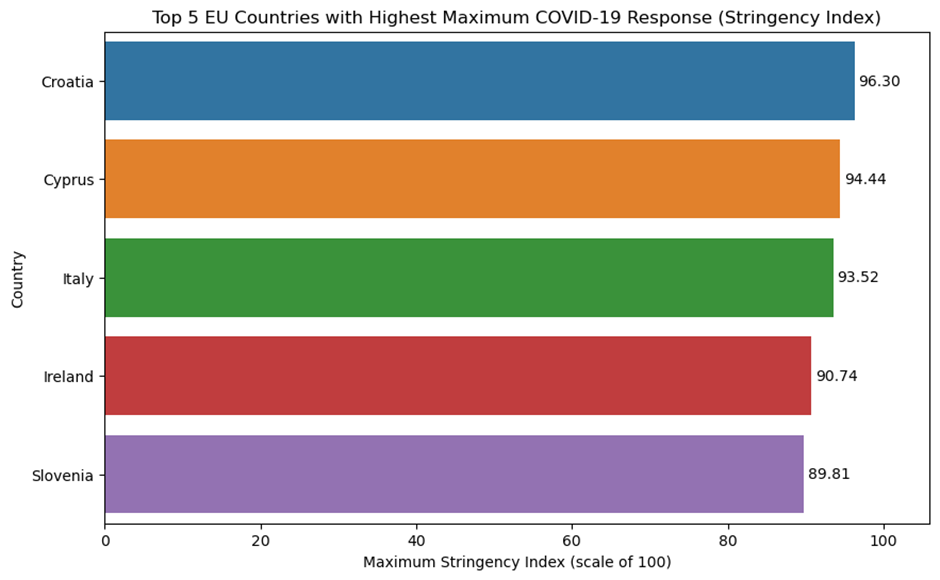
The third chart shifts focus to the highest maximum stringency index recorded in each EU country. Croatia, Cyprus, Italy, Ireland, and Slovenia implemented the strictest measures at their peak. Croatia topped this list with a maximum index of 96.30, signalling periods of near-total lockdown and highly restrictive public health protocols.
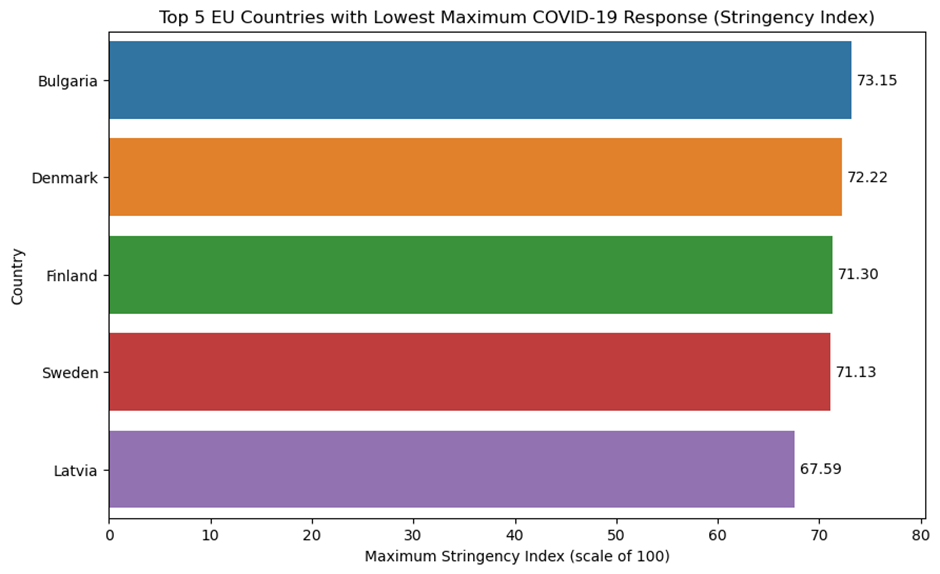
In contrast, the fourth chart displays the Top 5 EU countries with the lowest maximum stringency index, highlighting Latvia, Sweden, Finland, Denmark, and Bulgaria as the least restrictive at their most stringent point. Latvia, with a maximum index of 67.59, recorded the lowest peak response, suggesting that even at the height of intervention, its measures remained relatively moderate compared to other EU nations.
Together, these charts offer a comparative lens into the diverse policy responses adopted across Europe, underscoring the variability in government strategies during the COVID-19 crisis.
Categorical Variables and Time Dimensions:
To better explore trends, I created:
– Month
– Year
– Month-year
– Stringency Category (Low: 0–40, Medium: 41–69, High: 70–100)
All 27 EU countries had equal representation. Time was also evenly distributed, with consistent daily records throughout the three-year span, ensuring no seasonal or temporal bias.
The insights gotten so far guided the next layer of exploratory questions and statistical testing.
Exploratory Analysis
How Many Total Confirmed Cases Reported in the EU within 2020 and 2022 ?
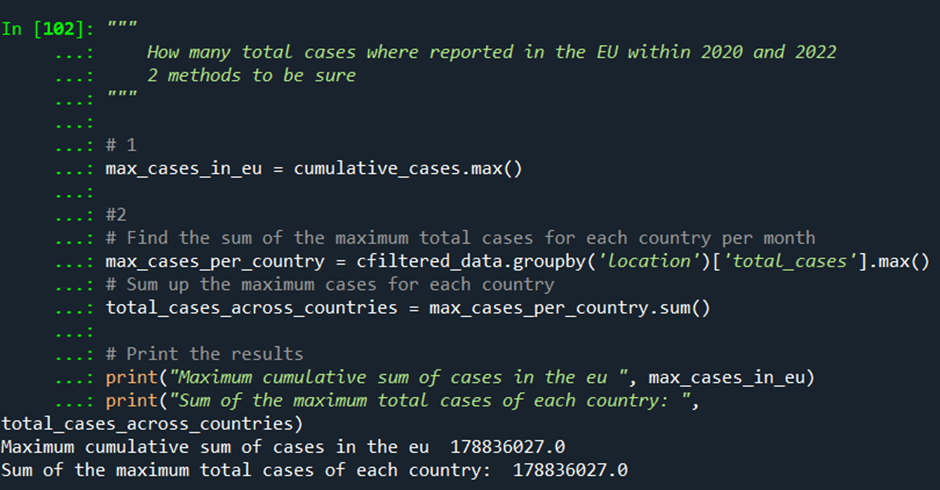
A total of 178,836,027 confirmed COVID-19 cases were recorded in the EU between 2020 and 2022. This figure does not account for unreported or undetected cases, which likely push the true number even higher. The scale of this count highlights just how contagious and widespread COVID-19 became across the region during the pandemic period.
What was the Cumulative Trend of Confirmed COVID-19 Cases Over Time in the EU between 2020 and 2022 ?
➤ Line Plot – Cumulative Trend of Confirmed COVID-19 Cases Over Time in the EU between 2020 and 2022
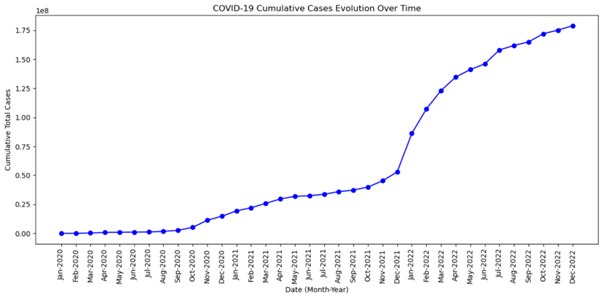
The trend of cumulative COVID-19 cases in the EU from 2020 to 2022 shows a steady rise, with major surges during key periods. The initial phase from January to August 2020 saw a slow growth, reaching 1.75 million cases by August. However, infections increased drastically in late 2020, hitting 11.3 million by November and 19.3 million by January 2021. This period was the first major wave, likely due to increased testing and colder weather, which may have facilitated virus transmission.
In 2021, case growth seemingly slowed due to vaccination efforts and public health measures, but infections still rose steadily, reaching 45.2 million by November. The situation changed in late 2021 and early 2022 with likely with the Omicron wave, leading to a massive surge from 52.8 million in December 2021 to 107.3 million by February 2022.
The case growth then started stabilized in mid to late 2022, reaching a total 178.8 million by year-end. Vaccinations surely played a role in controlling the spread. While COVID-19 remained present, the pandemic’s intensity seemingly declined, but we our data’s limited period length does not permit us to appreciate the deep in the years after.
What was the Trend of New Cases in the EU Over The Months (2020-2022)?
I analysed the trend of new COVID-19 cases over time by grouping the data by month_year and plotting new cases month by month. This provides a clearer picture of how new infections surged or declined throughout the period.
➤ Line Plot – New Cases Evolution in the EU Over The Months (2020 to 2022)
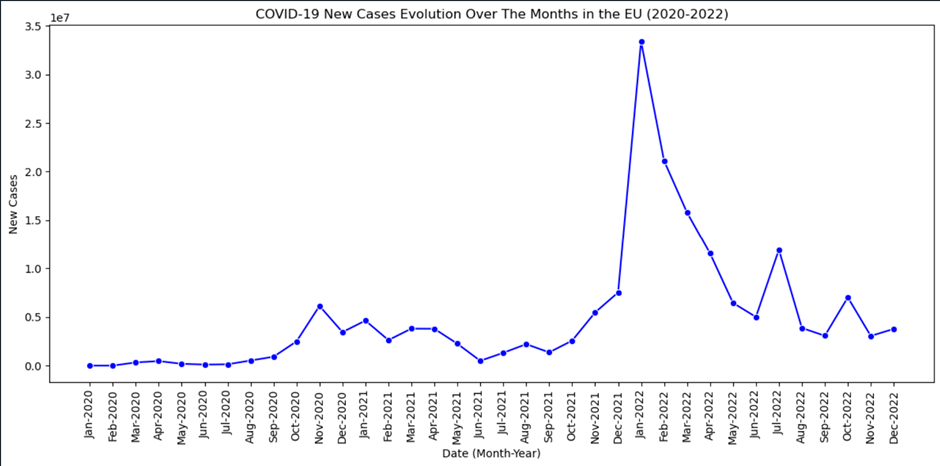
The trend of new COVID-19 cases in the EU between 2020 and 2022 shows multiple peaks, likely due to factors such as new variants, policy changes, and seasonal effects. Notably, major peaks occurred during autumn (September to November) and winter (December to February), when colder temperatures led to more indoor gatherings and a higher risk of transmission. The largest peak was in January 2022, surely driven by the Omicron variant, followed by another surge in February 2022. Smaller increases appeared in summer months, suggesting that warmer weather and outdoor activities may have helped reduce transmission.
The connection between colder months and higher case numbers is likely due to a combination of factors, including reduced ventilation indoors and the spread of seasonal respiratory illnesses. Similar patterns were observed in autumn and winter of 2020 and 2021, when cases surged following periods of lower transmission. While summer months showed relative declines, some exceptions, like July 2022, suggest that new variants or relaxed restrictions may have contributed to temporary increases.
How did different stringency categories compare in case numbers ?
For this analysis, the aim was to uncover how different stringency categories impacted the total number of new confirmed COVID-19 cases over the period from 2020 to 2022. To do this, I first grouped the data by the stringency category column and summed up the new_cases within each category. This allowed me to get the total number of cases for each stringency category (Low, Medium, High). After that, I used a bar plot to visualize the total new cases for each stringency category, with the x-axis representing the stringency categories and the y-axis representing the number of confirmed cases.
➤ Bar Plot – Total Confirmed New Cases by Stringency Category
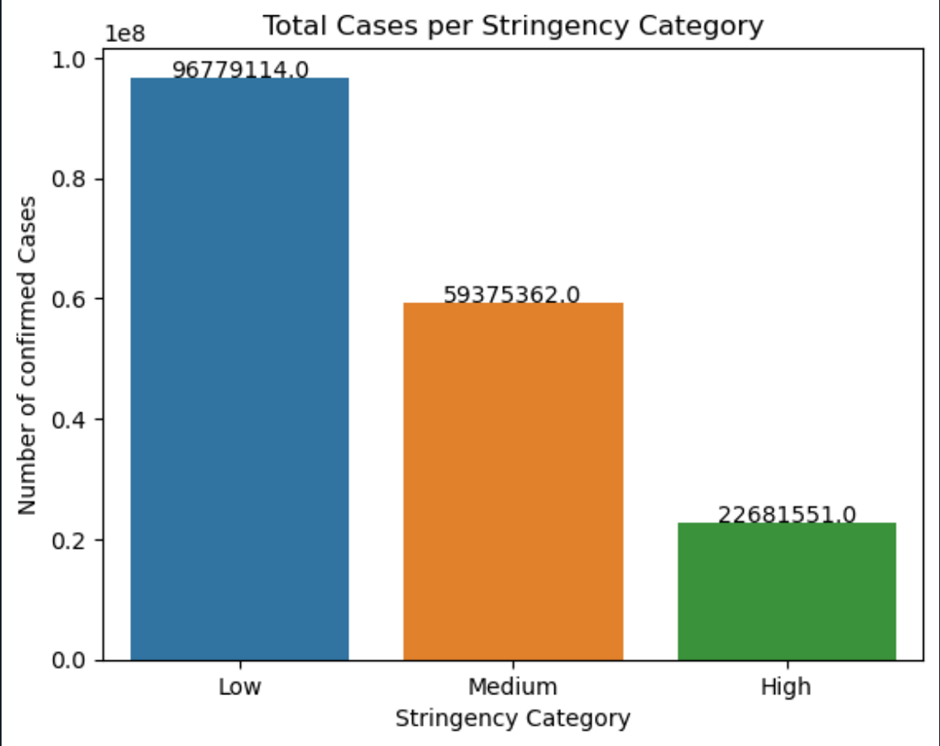
The bar chart above provides insights into the total number of confirmed cases across different stringency categories (Low, Medium, High). The data shows:
- Low Stringency (0–40): 96,779,114 ~ 96.7M cases
- Medium Stringency (41-69): 59,375,362 ~ 59.4M cases
- High Stringency (70-100): 22,681,551 ~ 22.6M cases
From this, we can observe that the Low Stringency category has the highest number of confirmed cases, followed by the Medium Stringency category, and High Stringency having the fewest cases. This could suggest that regions with lower restrictions (low stringency) may have experienced higher case numbers, possibly due to less restrictive measures such as lockdowns, social distancing, or travel restrictions.
What was the Trend of Government Response (Stringency Index) Over Time ?
This was obtained by computing the mean stringency index by month-year and plotting the trends, allowing me to compare how different countries adjusted their measures over time.
➤ Line Plot – Government Response (Stringency Index) Over Time

The trend of government response over time shows clear fluctuations, with the strictest measures occurring in the early months of the pandemic. Government restrictions peaked around spring 2020, likely due to initial uncertainty and efforts to contain the rapid virus spread. Through-out 2020 and early 2021, the response remained quite high, reflecting prolonged lockdowns, travel bans, and social distancing mandates. However, from mid-2021 onward, it declined steadily, likely due to increased vaccination rates and shifting strategies toward managing rather than preventing infections.
By 2022, restrictions had eased significantly The decline in strict measures during this period is likely due to vaccinations, growing immunity, and reduced severity of newer variants. Overall, the timeline shows indicates a decline in government response strictness, although not without some fluctuation. This requires further investigation of the correlation between the stringency index and the number of new confirmed cases.
Exploring Correlation Between Stringency Index and COVID-19 Confirmed Case Counts
As a preliminary step toward understanding how government responses may have influenced the pandemic’s spread, I ran a basic correlation analysis between the stringency index and confirmed COVID-19 cases. While this approach is limited, as it does not account for interactions with other variables or time-lagged effects, it provides a useful high-level view. Two case metrics were tested: daily new cases and total cases per million, helping to distinguish between short-term volatility and long-term patterns
Stringency Index vs New Cases:
➤ Scatterplot with Regression Line
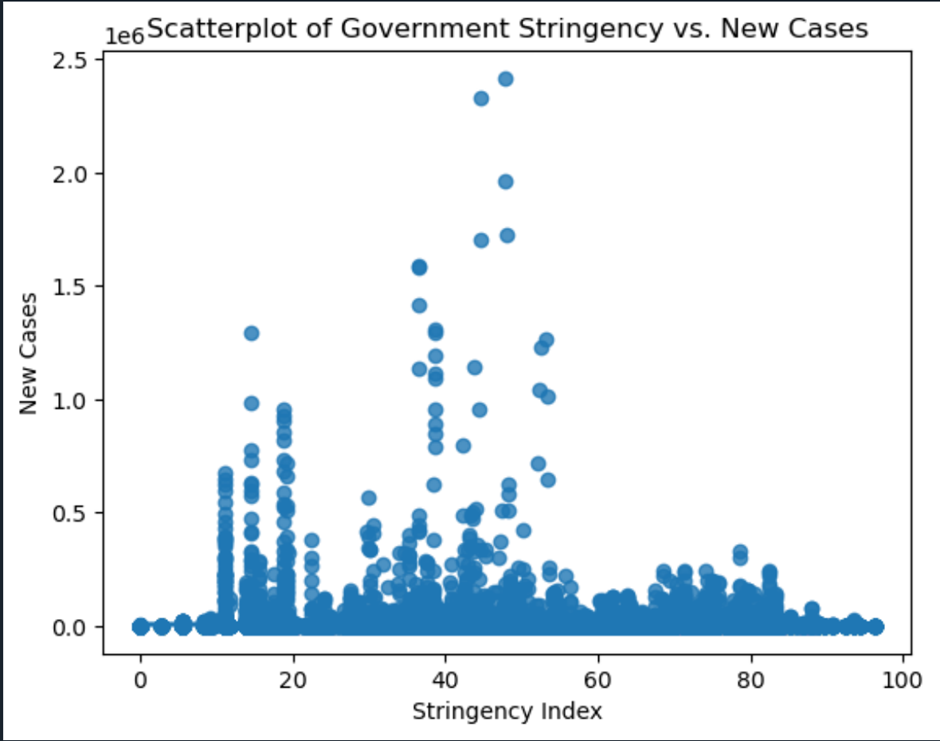
Pearson correlation coefficient: -0.0076
The Pearson correlation coefficient was -0.0076, indicating an extremely weak inverse relationship between government-imposed restrictions and daily new case counts. At first glance, this might seem surprising, one would expect stricter measures to reduce daily infections. However, daily new cases are highly volatile, influenced by short-term factors like testing availability, reporting delays, public behaviour, and emerging variants.
Moreover, in many cases, stringent measures were reactive, introduced in response to surging infections. This can temporarily blur any apparent relationship, as case spikes may coincide with or even precede restrictions. Therefore, the near-zero correlation does not necessarily imply that restrictions were ineffective, but rather that their short-term impact on daily case numbers is difficult to detect statistically in isolation.
Stringency Index vs Total Cases per Million:
➤ Scatterplot with Regression Line
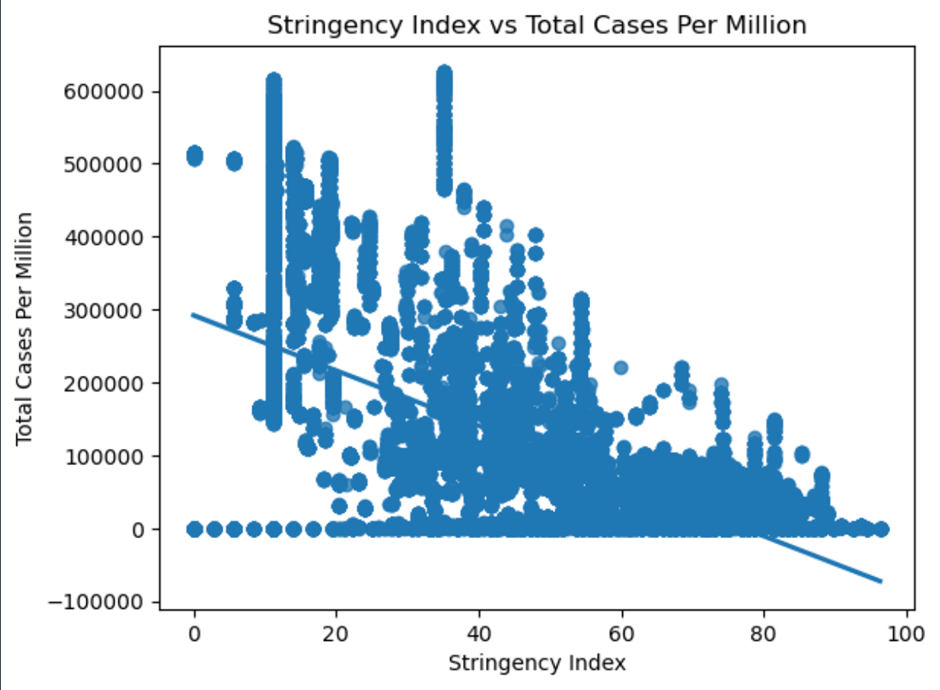
Pearson correlation: -0.5764
In contrast, the Pearson correlation between stringency and total confirmed cases per million was -0.5764, suggesting a moderate negative relationship. This means that countries with higher average stringency levels over the study period tended to have fewer total infections relative to their population size.
This result makes more intuitive sense. While daily cases fluctuate, total cases per million capture the long-term trajectory of the pandemic in each country. Over time, consistent and well-enforced restrictions likely helped limit the virus’s spread, contributing to lower cumulative infection rates. This correlation supports the idea that sustained governmental interventions had a meaningful impact, even if that impact wasn’t always visible in day-to-day fluctuations.
Why the Difference?
The key difference lies in what each variable measures and the time scale involved. Daily new cases reflect short-term dynamics, where policy effects can be delayed or masked by other factors. Total cases per million, on the other hand, reflect long-term outcomes, offering a clearer view of the cumulative impact of government responses.
Taken together, these findings highlight the complexity of pandemic management and the importance of considering both immediate and long-term effects when evaluating policy effectiveness.
Final Reflections and Conclusion
This analysis examined how the COVID-19 pandemic unfolded across EU countries (excluding the UK) from 2020 to 2022, focusing on the relationship between government stringency measures and confirmed COVID-19 cases.
The correlation results revealed a very weak negative relationship between the stringency index and daily new cases (Pearson: -0.0076), suggesting short-term policy strictness had little immediate impact on case fluctuations, likely influenced by factors like testing practices and virus variants.
In contrast, the relationship between the stringency index and total cases per million was moderately negative (Pearson: -0.5764), implying that countries with stricter measures had fewer cumulative infections per capita. While this doesn’t confirm causality, it points to potential long-term benefits of rigorous interventions.
Key insights from the data include:
- The EU recorded 178,836,027 confirmed cases from 2020 to 2022—likely an undercount.
- France had the highest number of total cases, while Austria had the higher number of cases per million.
- Greece had the highest average stringency, and Estonia the lowest, showing different national responses.
- The Omicron surge in early 2022 caused the steepest rise in cases.
- Reporting of the stringency index dropped significantly after 2022, likely due to lifted restrictions.
The analysis focused solely on the stringency index’s relationship with confirmed cases. It didn’t explore how these variables interacted with others or how combined factors might explain broader trends, leaving plenty of room for further research.
Final Reflections and Conclusion
Future exploration could look at other relationships, such as how median age, vaccination rates, or mobility trends influenced infection patterns. Including the UK, which was part of the EU early in the pandemic, might provide a more complete regional perspective. I decided to exclude it for this exercise, but its inclusion could offer additional insights.
Another option would be grouping countries by population density, as was done with the stringency index, to better understand the influence of urbanization.
To minimize extreme variations across the 27 EU countries, I may focus on two countries, such as Ireland vs. UK, Austria vs. Poland, or Italy vs. Germany, for more targeted comparisons. Alternatively, I could expand the scope to compare continents, such as Europe vs. South America, or countries with different characteristics like population size, demographics, and healthcare infrastructure.
There are numerous possibilities for further exploration.
Overall, this exercise was both fun and educational. I learned to work with new tools (Spyder, Python), practiced data analysis techniques, and interpreted analytical results while revisiting assumptions. The process was technically enriching and personally rewarding.
Final Reflections and Conclusion
Ritchie, H., Mathieu, E., Rodés-Guirao, L., Appel, C., Giattino, C., Ortiz-Ospina, E., Hasell, J., Macdonald, B., Beltekian, D., and Roser, M. (2020) ‘Coronavirus Pandemic (COVID-19)’, Our World in Data. Available at: https://github.com/owid/covid-19-data/blob/master/public/data/owid-covid-data.csv (Accessed: 23 March 2025).
European Union (n.d.) ‘EU countries’, European Union Official Website. Available at: https://european-union.europa.eu/principles-countries-history/eu-countries_en#header_countries_list (Accessed: 23 March 2025).
Mullally, B. (n.d.) ‘Data Science in Practice’, Computing Department, SETU Waterford. Available at: www.setu.ie
The python code used to generate the statistics and create the charts is not included in this written piece. However, the code file and the original report are available upon request for anyone who would like a closer look.